## Global analysis (full portfolio always invested)
Analysis of the portfolio (2000-40 / 2002-40) :
-----------------------------------------------------
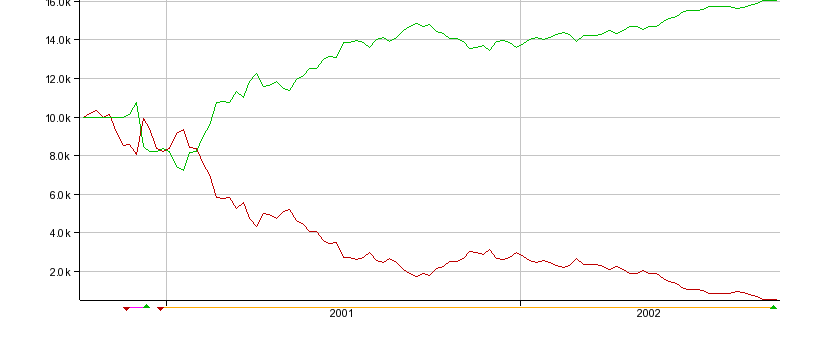
Performance : 60.7% ( 26.5%) Buy & Hold : -96.7% (-81.6%) () => by year
MaxDrawDown : 17.8% B&H MaxDrawDown : 97.4%
Best performance : 60.7% Worst performance : -17.8%
Net gain : 6069.65 Gross gain : 6069.65
Trades statistics :
Number of trades : 2 Trades/Year : 1.00
Number of gains : 1 Number of losses : 1 Win. ratio : 50.0%
Max consec. win : 1 Max consec. loss : 1 Expectancy : 0.39
Average gain : 96.02% Average loss : -17.45% Avg. perf : 26.77%
Biggest gain : 96.02% Biggest loss : -17.45% Profit fac : 5.50
Sum of gains : 7853.65 Sum of losses : -1784.00 Risk of ruin : 40.2%
|